Salesforce campaign attribution can be difficult for conversational marketing sources. Visit the Qualified blog to learn how to set up campaign attribution for conversational marketing in Salesforce.
Joe Casson
No items found.
This blog is Part One of a Two Part Series on Campaign Reporting: Attribution and Influence. If you’re new to reporting on Qualified in Salesforce, this post on Salesforce Ben breaks it all down: Report on Conversational Marketing in Salesforce!
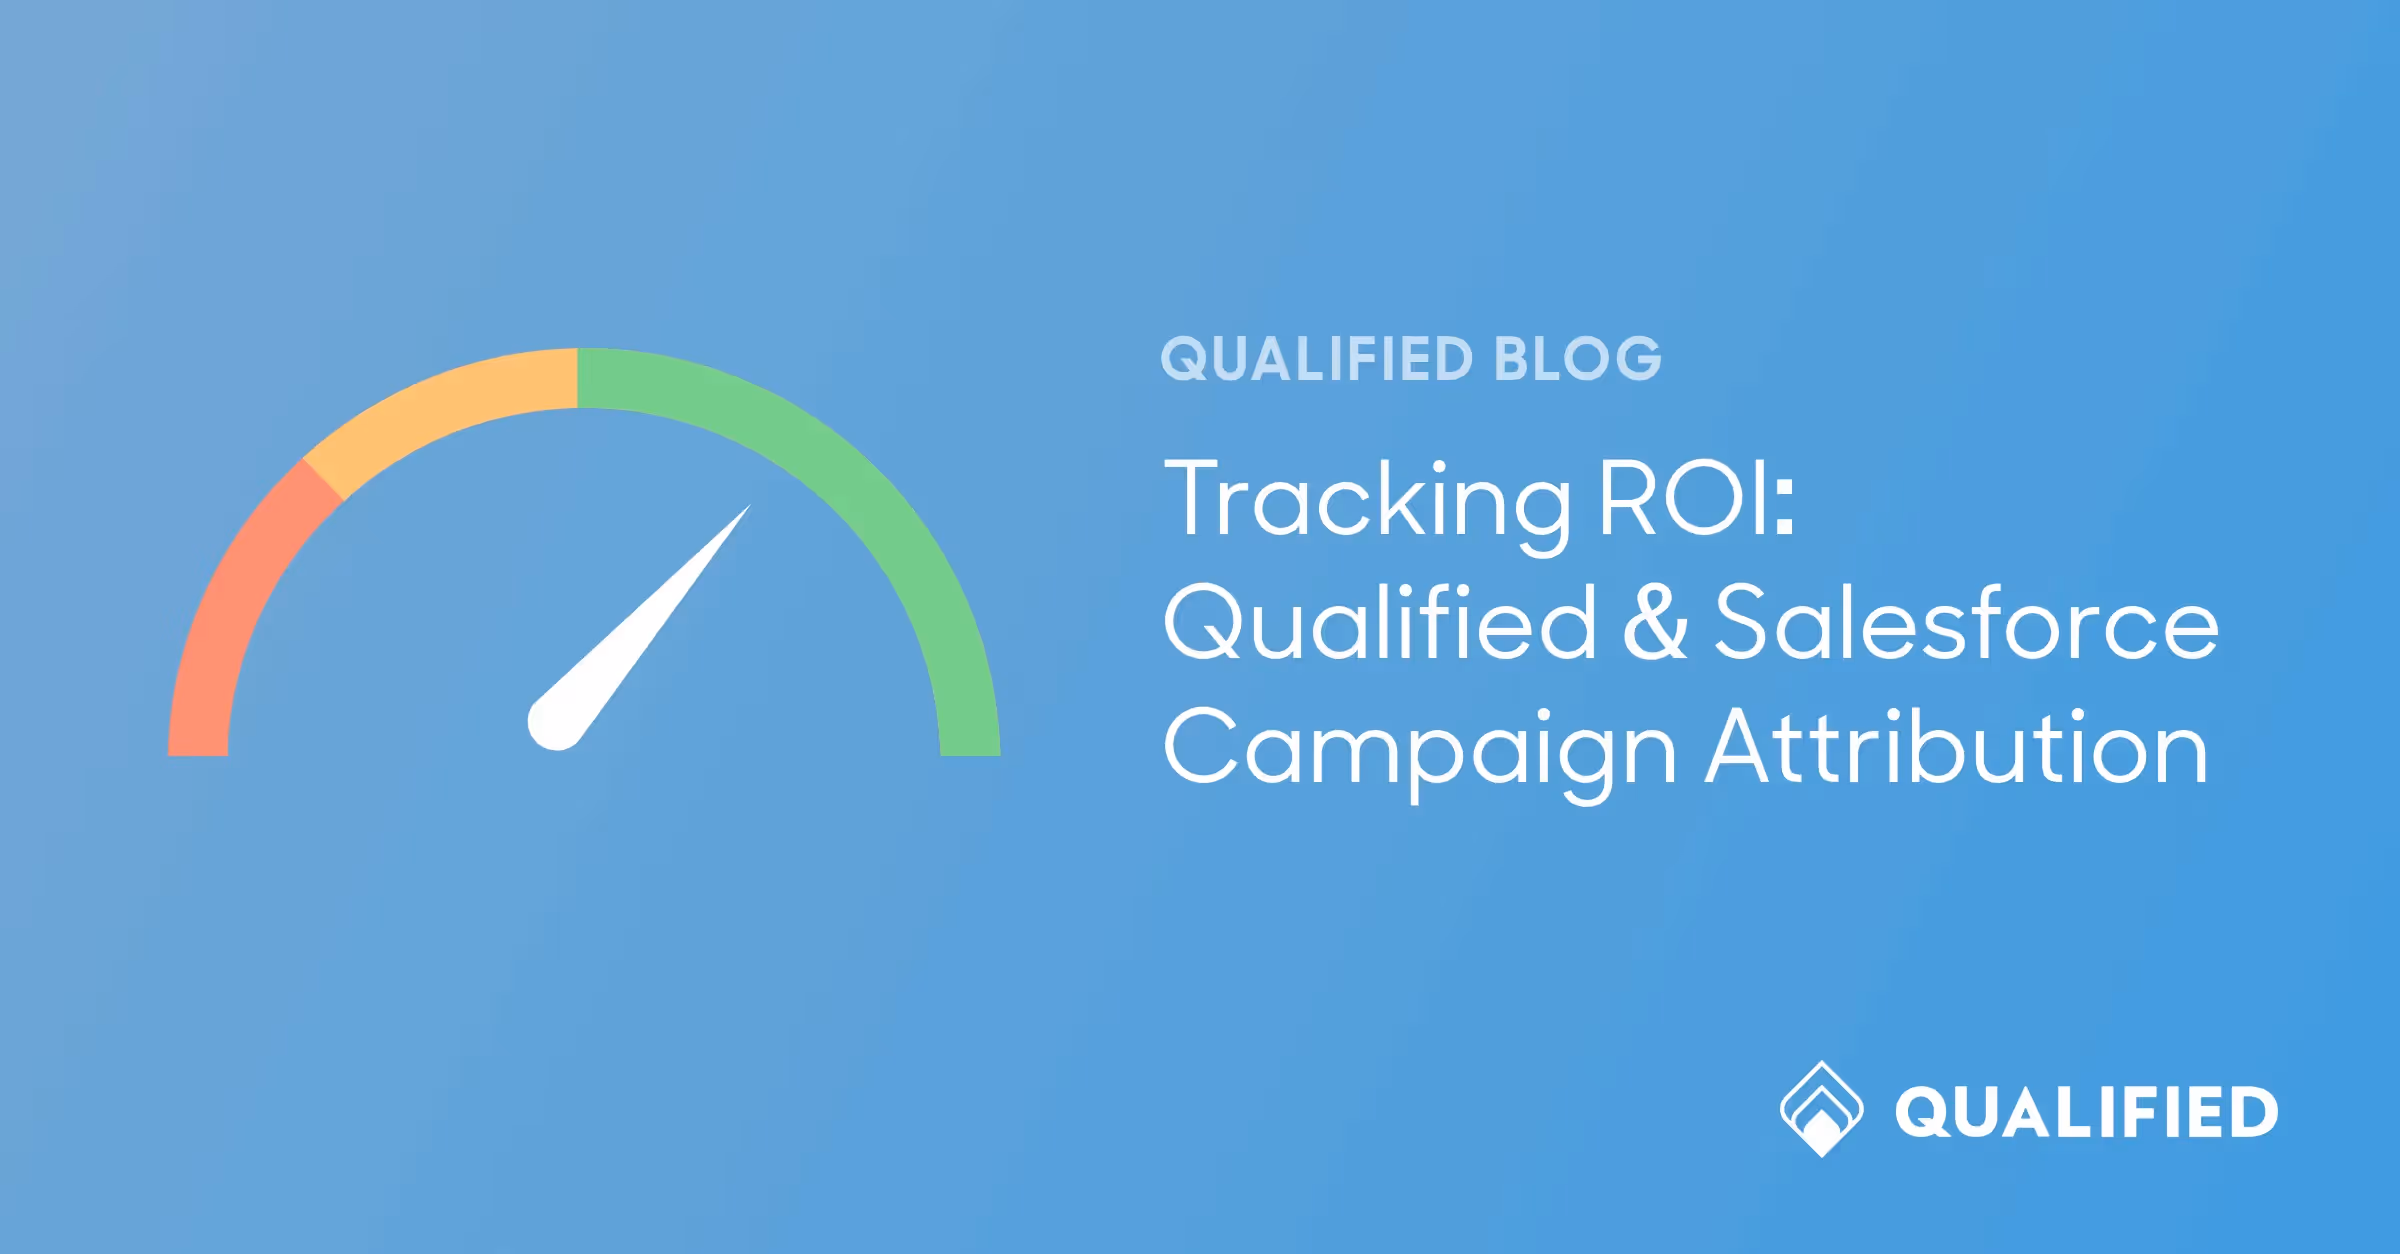
Tracking Conversational Marketing campaign attribution in Salesforce
Takeaway - Build your Conversational Marketing campaign attribution reports where your entire team can access and understand them: in Salesforce.
Qualified.com is purpose-built for Salesforce. It allows your team to engage with top prospects and customers as they visit your website. As we’ve seen in our customer stories, the impact of this is enormous. Qualified customers are generating thousands of leads and adding millions of dollars to their pipeline within months of using Qualified. These are huge wins that deserve to be shared! Before we get there, you need to be able to report on it.
Good reporting is critical. It is important to clearly and concretely understand the impact of your efforts. It’s a simple notion, but it’s one we seek to embrace at Qualified. If you can’t readily understand it, how do you know it’s worth your time? You don’t.
Another belief is: “if it isn’t in Salesforce, it didn’t happen”. A little tongue-in-cheek, but we mean it in earnest. Salesforce is the maypole for many organizations. Sure, a user of Qualified may want to dive into the app’s native dashboards, but it’s also valuable to surface reports where your Head of Sales, Head of Demand Gen, and C-Level execs spend their time: Salesforce.
In this post, we’ll put these beliefs into action. We’ll make the fruits of your labor clear and in place where everyone can access, using tools that are already at your fingertips. Enter: Salesforce Campaign Attribution.
Takeaway - Salesforce Campaign Attribution is a great way to measure your marketing effectiveness because the data is verifiable.
Before we apply Campaign Attribution to Conversational Marketing, let’s go through a quick Campaign Attribution refresher.
Campaign Attribution is when a Lead or Contact is a Campaign Member of your Campaign(s) and they have interacted with you as a result of the Campaign(s). You can use this knowledge to see which Campaigns have impacted important metrics like “Leads Generated” and “Converted Leads”.
When diving into the world of reporting on your campaigns’ performance, Campaign Attribution is the first step. The reason is simple: Campaign Attribution is as black and white as it gets. It did or it didn't happen. They clicked on your ad or they didn’t. They responded to your chat message on the website or they didn’t. Where Campaign Influence can be hotly contested, Campaign Attribution is much clearer.
Moreover, Campaign Attribution makes a dramatic improvement on the first iteration of tracking Campaign effectiveness, the dreaded Primary Campaign Source. *shudders*
Campaign Attribution can show how multiple Campaigns have been attributed to a Lead/Contact. Aside from providing a simply more comprehensive picture of your Campaign Members (and, later, Campaign Influence), it has direct benefit for Qualified customers.
Here's a sample Lead with a Campaign attributed in the Campaign History Related List
Salesforce campaign attribution in the world of Conversational Marketing
Takeaway - Campaign Attribution can be applied to Experiences to track which Leads and Contacts engaged with your team.
If your team is considering or already pursuing Conversational Marketing, Campaign Attribution will be the best fitting piece to complete the puzzle.
In fact, Conversational Marketing Experiences are most often categorized as Campaigns alongside your Email, Webinar, and In-Person Event Campaigns. This means you don’t have to change a thing to your Campaign Dashboards to measure Conversational Marketing impact in 2022. You’ll be tracking it the moment you send your first chat.
But wait, there’s more!
When a visitor engages with one of your Experiences, you can attribute specific Parent/Child Campaigns based upon those Qualified Experiences. For example, a teaser for a hot new blog post got a Contact from a Target Account to click? Attribute that Experience. You sent a relevant and timely message to that same target visitor and it started a conversation? Attribute that Experience to that Contact, too.
Add website visitors to multiple Conversational Marketing campaigns as they interact with your experiences
Soon enough, you’ll have a detailed understanding of how your Conversational Marketing Experiences have impacted website-driven leads and pipeline. Analytically-driven Demand Gen teams rejoice!
Now that you’ve gotten a glimpse of what’s possible by reporting on Conversational Marketing with Campaign Attribution, let’s get into some specific reports.
Salesforce Campaign Attribution allows your team to answer the following about your Conversational Marketing Campaigns:
How many Leads were created as a result of an Experience?
Has a Lead or Contact engaged with my company via an Experience?
Which Experiences have been the most effective at getting my existing customers or target prospects to engage?
Before we dive into how they were built, keep in mind that all Qualified customers are able to get these reports out of the box. Click a link, make some tweaks, and you’ll be up and tracking ROI in no time. Hallelujah!
Now, let’s get into them.
#1. How many leads were created as a result of an Experience?
Report Type
Leads and Converted Lead Information
Title
Leads Created by Qualified, Last 90 Days
Description
90 day look-back on Leads that have Qualified.com as the Lead Source - 1st Touch. This includes Converted and Unconverted Leads.
Filters
Show me: All leads
Lead Source: Equals Website Conversation or starts with Qualified.com
This depends on what your organization has called this particular value.
Keep in mind, this field needs to be static. If it is overwritten at any point, then our data is now unreliable.
Created Date: LAST 90 DAYS
We use this for our Attribution reports because it gives a Goldilocks view of our Attribution trends. LAST 30 DAYS was too focused to see how we compared to prior efforts and LAST 6 MONTHS+ was too high level to be actionable.
Groups
Lead Status
Created Date
We suggest additionally grouping this by calendar week or month. This makes the report much more digestible and actionable.
Columns
The default fields included when you create the report are fine.
#2. How many leads/contacts have engaged with my company via a Conversational Marketing Experience?
Report Type
We’ll create two different versions of the same report, one for Leads and one for Contacts. If you’re an Advanced Reports user, you can use a Custom Report Type, too!).
Campaigns with Leads and Converted Lead Information
Campaigns with Contacts
Title
Leads / Contacts Attributed to Qualified.com
Filters
Show me: All Campaigns
Campaign Name: starts with Qualified.com
Member First Associated Date: LAST 90 DAYS
We use this for our Attribution reports because it gives a Goldilocks view of our Attribution trends. LAST 30 DAYS was too focused to see how we compared to prior efforts and LAST 6 MONTHS+ was too high level to be actionable.
Groups
Campaign Name
Member First Associated Date
We suggest additionally grouping this by calendar week or month. This makes the report much more digestible and actionable.
Lead Status
We won’t use this now, but will be helpful for future reports in Campaign Influence
Columns
The default fields included when you create the report are fine.
#3. Which Experiences have been the most effective at getting my existing customers or target prospects to engage?
Report Type
Campaigns with Contacts
Title
Target Accounts and Customers Attributed to Qualified.com
Filters
Show me: All Campaigns
Campaign name starts with Qualified.com
Member First Associated Date: LAST 90 DAYS
Target Account Field: Your Target Account Criteria
This field changes for every organization. Find the right
Account Type: Customer
Filter Logic
1 AND 2 (3 OR 4)
This will let you see Existing Customers OR Prospects Accounts that match your Target Account Criteria. Feel free to modify this to your business needs!
Groups
Campaign Name
Member First Associated Date
We suggest additionally grouping this by calendar week or month. This makes the report much more digestible and actionable.
Columns
The default fields included when you create the report are fine.
The finished product: your ROI dashboard
Takeaway - We like 90 day trends and simple number visualizations. This helps our team be actionable but with Executive-level clarity.
After you’ve built the campaign attribution reports, you’ll have plenty of flexibility on how you’d like to visualize the data. For our internal Dashboard and many of our customers, we’ve set it up to look like what you see below.
Create Campaign Attribution Reports and Dashboards to measure the impact of Conversational Marketing
Why did we choose these visualizations? When we create dashboards, we try to answer two questions:
Does the dashboard present the data in a way to give me an actionable next step?
Does it allow me to tell the story I need to tell to my team?
Is it easy to read?
For these visualizations, we’re interested in:
Trends over time (90 days) to see how changes in our marketing efforts may have impacted the Qualified output.
Breakdown by major categories that matter to us, either by Campaign or by some firmographic information like ICP.
Make it simple to see how we’re doing for the Fiscal Quarter and the 90 day window.
As you can see, our methodology isn’t anything crazy or groundbreaking. We believe in clear, digestible data to showcase the impact of the Marketing Team’s efforts. Most importantly, we believe in showcasing it where your entire team lives: inside of Salesforce.
If you have any questions or want to learn more about our Salesforce Campaign Attribution Reports and Dashboards, please feel free to reach out. You can reach me at [email protected] or simply come to the website to speak with us there. See you on the site!
Related content
Explore the Qualified+ Library
Category
Stay up to date with weekly drops of fresh B2B marketing and sales content.
Thank you for subscribing. You’ll start receiving updates for Qualified+ shortly.
Oops! Something went wrong while submitting the form.
Salesforce campaign attribution can be difficult for conversational marketing sources. Visit the Qualified blog to learn how to set up campaign attribution for conversational marketing in Salesforce.
Joe Casson
No items found.
This blog is Part One of a Two Part Series on Campaign Reporting: Attribution and Influence. If you’re new to reporting on Qualified in Salesforce, this post on Salesforce Ben breaks it all down: Report on Conversational Marketing in Salesforce!
Tracking Conversational Marketing campaign attribution in Salesforce
Takeaway - Build your Conversational Marketing campaign attribution reports where your entire team can access and understand them: in Salesforce.
Qualified.com is purpose-built for Salesforce. It allows your team to engage with top prospects and customers as they visit your website. As we’ve seen in our customer stories, the impact of this is enormous. Qualified customers are generating thousands of leads and adding millions of dollars to their pipeline within months of using Qualified. These are huge wins that deserve to be shared! Before we get there, you need to be able to report on it.
Good reporting is critical. It is important to clearly and concretely understand the impact of your efforts. It’s a simple notion, but it’s one we seek to embrace at Qualified. If you can’t readily understand it, how do you know it’s worth your time? You don’t.
Another belief is: “if it isn’t in Salesforce, it didn’t happen”. A little tongue-in-cheek, but we mean it in earnest. Salesforce is the maypole for many organizations. Sure, a user of Qualified may want to dive into the app’s native dashboards, but it’s also valuable to surface reports where your Head of Sales, Head of Demand Gen, and C-Level execs spend their time: Salesforce.
In this post, we’ll put these beliefs into action. We’ll make the fruits of your labor clear and in place where everyone can access, using tools that are already at your fingertips. Enter: Salesforce Campaign Attribution.
Takeaway - Salesforce Campaign Attribution is a great way to measure your marketing effectiveness because the data is verifiable.
Before we apply Campaign Attribution to Conversational Marketing, let’s go through a quick Campaign Attribution refresher.
Campaign Attribution is when a Lead or Contact is a Campaign Member of your Campaign(s) and they have interacted with you as a result of the Campaign(s). You can use this knowledge to see which Campaigns have impacted important metrics like “Leads Generated” and “Converted Leads”.
When diving into the world of reporting on your campaigns’ performance, Campaign Attribution is the first step. The reason is simple: Campaign Attribution is as black and white as it gets. It did or it didn't happen. They clicked on your ad or they didn’t. They responded to your chat message on the website or they didn’t. Where Campaign Influence can be hotly contested, Campaign Attribution is much clearer.
Moreover, Campaign Attribution makes a dramatic improvement on the first iteration of tracking Campaign effectiveness, the dreaded Primary Campaign Source. *shudders*
Campaign Attribution can show how multiple Campaigns have been attributed to a Lead/Contact. Aside from providing a simply more comprehensive picture of your Campaign Members (and, later, Campaign Influence), it has direct benefit for Qualified customers.
Here's a sample Lead with a Campaign attributed in the Campaign History Related List
Salesforce campaign attribution in the world of Conversational Marketing
Takeaway - Campaign Attribution can be applied to Experiences to track which Leads and Contacts engaged with your team.
If your team is considering or already pursuing Conversational Marketing, Campaign Attribution will be the best fitting piece to complete the puzzle.
In fact, Conversational Marketing Experiences are most often categorized as Campaigns alongside your Email, Webinar, and In-Person Event Campaigns. This means you don’t have to change a thing to your Campaign Dashboards to measure Conversational Marketing impact in 2022. You’ll be tracking it the moment you send your first chat.
But wait, there’s more!
When a visitor engages with one of your Experiences, you can attribute specific Parent/Child Campaigns based upon those Qualified Experiences. For example, a teaser for a hot new blog post got a Contact from a Target Account to click? Attribute that Experience. You sent a relevant and timely message to that same target visitor and it started a conversation? Attribute that Experience to that Contact, too.
Add website visitors to multiple Conversational Marketing campaigns as they interact with your experiences
Soon enough, you’ll have a detailed understanding of how your Conversational Marketing Experiences have impacted website-driven leads and pipeline. Analytically-driven Demand Gen teams rejoice!
Now that you’ve gotten a glimpse of what’s possible by reporting on Conversational Marketing with Campaign Attribution, let’s get into some specific reports.
Salesforce Campaign Attribution allows your team to answer the following about your Conversational Marketing Campaigns:
How many Leads were created as a result of an Experience?
Has a Lead or Contact engaged with my company via an Experience?
Which Experiences have been the most effective at getting my existing customers or target prospects to engage?
Before we dive into how they were built, keep in mind that all Qualified customers are able to get these reports out of the box. Click a link, make some tweaks, and you’ll be up and tracking ROI in no time. Hallelujah!
Now, let’s get into them.
#1. How many leads were created as a result of an Experience?
Report Type
Leads and Converted Lead Information
Title
Leads Created by Qualified, Last 90 Days
Description
90 day look-back on Leads that have Qualified.com as the Lead Source - 1st Touch. This includes Converted and Unconverted Leads.
Filters
Show me: All leads
Lead Source: Equals Website Conversation or starts with Qualified.com
This depends on what your organization has called this particular value.
Keep in mind, this field needs to be static. If it is overwritten at any point, then our data is now unreliable.
Created Date: LAST 90 DAYS
We use this for our Attribution reports because it gives a Goldilocks view of our Attribution trends. LAST 30 DAYS was too focused to see how we compared to prior efforts and LAST 6 MONTHS+ was too high level to be actionable.
Groups
Lead Status
Created Date
We suggest additionally grouping this by calendar week or month. This makes the report much more digestible and actionable.
Columns
The default fields included when you create the report are fine.
#2. How many leads/contacts have engaged with my company via a Conversational Marketing Experience?
Report Type
We’ll create two different versions of the same report, one for Leads and one for Contacts. If you’re an Advanced Reports user, you can use a Custom Report Type, too!).
Campaigns with Leads and Converted Lead Information
Campaigns with Contacts
Title
Leads / Contacts Attributed to Qualified.com
Filters
Show me: All Campaigns
Campaign Name: starts with Qualified.com
Member First Associated Date: LAST 90 DAYS
We use this for our Attribution reports because it gives a Goldilocks view of our Attribution trends. LAST 30 DAYS was too focused to see how we compared to prior efforts and LAST 6 MONTHS+ was too high level to be actionable.
Groups
Campaign Name
Member First Associated Date
We suggest additionally grouping this by calendar week or month. This makes the report much more digestible and actionable.
Lead Status
We won’t use this now, but will be helpful for future reports in Campaign Influence
Columns
The default fields included when you create the report are fine.
#3. Which Experiences have been the most effective at getting my existing customers or target prospects to engage?
Report Type
Campaigns with Contacts
Title
Target Accounts and Customers Attributed to Qualified.com
Filters
Show me: All Campaigns
Campaign name starts with Qualified.com
Member First Associated Date: LAST 90 DAYS
Target Account Field: Your Target Account Criteria
This field changes for every organization. Find the right
Account Type: Customer
Filter Logic
1 AND 2 (3 OR 4)
This will let you see Existing Customers OR Prospects Accounts that match your Target Account Criteria. Feel free to modify this to your business needs!
Groups
Campaign Name
Member First Associated Date
We suggest additionally grouping this by calendar week or month. This makes the report much more digestible and actionable.
Columns
The default fields included when you create the report are fine.
The finished product: your ROI dashboard
Takeaway - We like 90 day trends and simple number visualizations. This helps our team be actionable but with Executive-level clarity.
After you’ve built the campaign attribution reports, you’ll have plenty of flexibility on how you’d like to visualize the data. For our internal Dashboard and many of our customers, we’ve set it up to look like what you see below.
Create Campaign Attribution Reports and Dashboards to measure the impact of Conversational Marketing
Why did we choose these visualizations? When we create dashboards, we try to answer two questions:
Does the dashboard present the data in a way to give me an actionable next step?
Does it allow me to tell the story I need to tell to my team?
Is it easy to read?
For these visualizations, we’re interested in:
Trends over time (90 days) to see how changes in our marketing efforts may have impacted the Qualified output.
Breakdown by major categories that matter to us, either by Campaign or by some firmographic information like ICP.
Make it simple to see how we’re doing for the Fiscal Quarter and the 90 day window.
As you can see, our methodology isn’t anything crazy or groundbreaking. We believe in clear, digestible data to showcase the impact of the Marketing Team’s efforts. Most importantly, we believe in showcasing it where your entire team lives: inside of Salesforce.
If you have any questions or want to learn more about our Salesforce Campaign Attribution Reports and Dashboards, please feel free to reach out. You can reach me at [email protected] or simply come to the website to speak with us there. See you on the site!
Salesforce campaign attribution can be difficult for conversational marketing sources. Visit the Qualified blog to learn how to set up campaign attribution for conversational marketing in Salesforce.
Joe Casson
|
July 9, 2020
|
X
min read
Link Copied
This blog is Part One of a Two Part Series on Campaign Reporting: Attribution and Influence. If you’re new to reporting on Qualified in Salesforce, this post on Salesforce Ben breaks it all down: Report on Conversational Marketing in Salesforce!
Tracking Conversational Marketing campaign attribution in Salesforce
Takeaway - Build your Conversational Marketing campaign attribution reports where your entire team can access and understand them: in Salesforce.
Qualified.com is purpose-built for Salesforce. It allows your team to engage with top prospects and customers as they visit your website. As we’ve seen in our customer stories, the impact of this is enormous. Qualified customers are generating thousands of leads and adding millions of dollars to their pipeline within months of using Qualified. These are huge wins that deserve to be shared! Before we get there, you need to be able to report on it.
Good reporting is critical. It is important to clearly and concretely understand the impact of your efforts. It’s a simple notion, but it’s one we seek to embrace at Qualified. If you can’t readily understand it, how do you know it’s worth your time? You don’t.
Another belief is: “if it isn’t in Salesforce, it didn’t happen”. A little tongue-in-cheek, but we mean it in earnest. Salesforce is the maypole for many organizations. Sure, a user of Qualified may want to dive into the app’s native dashboards, but it’s also valuable to surface reports where your Head of Sales, Head of Demand Gen, and C-Level execs spend their time: Salesforce.
In this post, we’ll put these beliefs into action. We’ll make the fruits of your labor clear and in place where everyone can access, using tools that are already at your fingertips. Enter: Salesforce Campaign Attribution.
Takeaway - Salesforce Campaign Attribution is a great way to measure your marketing effectiveness because the data is verifiable.
Before we apply Campaign Attribution to Conversational Marketing, let’s go through a quick Campaign Attribution refresher.
Campaign Attribution is when a Lead or Contact is a Campaign Member of your Campaign(s) and they have interacted with you as a result of the Campaign(s). You can use this knowledge to see which Campaigns have impacted important metrics like “Leads Generated” and “Converted Leads”.
When diving into the world of reporting on your campaigns’ performance, Campaign Attribution is the first step. The reason is simple: Campaign Attribution is as black and white as it gets. It did or it didn't happen. They clicked on your ad or they didn’t. They responded to your chat message on the website or they didn’t. Where Campaign Influence can be hotly contested, Campaign Attribution is much clearer.
Moreover, Campaign Attribution makes a dramatic improvement on the first iteration of tracking Campaign effectiveness, the dreaded Primary Campaign Source. *shudders*
Campaign Attribution can show how multiple Campaigns have been attributed to a Lead/Contact. Aside from providing a simply more comprehensive picture of your Campaign Members (and, later, Campaign Influence), it has direct benefit for Qualified customers.
Here's a sample Lead with a Campaign attributed in the Campaign History Related List
Salesforce campaign attribution in the world of Conversational Marketing
Takeaway - Campaign Attribution can be applied to Experiences to track which Leads and Contacts engaged with your team.
If your team is considering or already pursuing Conversational Marketing, Campaign Attribution will be the best fitting piece to complete the puzzle.
In fact, Conversational Marketing Experiences are most often categorized as Campaigns alongside your Email, Webinar, and In-Person Event Campaigns. This means you don’t have to change a thing to your Campaign Dashboards to measure Conversational Marketing impact in 2022. You’ll be tracking it the moment you send your first chat.
But wait, there’s more!
When a visitor engages with one of your Experiences, you can attribute specific Parent/Child Campaigns based upon those Qualified Experiences. For example, a teaser for a hot new blog post got a Contact from a Target Account to click? Attribute that Experience. You sent a relevant and timely message to that same target visitor and it started a conversation? Attribute that Experience to that Contact, too.
Add website visitors to multiple Conversational Marketing campaigns as they interact with your experiences
Soon enough, you’ll have a detailed understanding of how your Conversational Marketing Experiences have impacted website-driven leads and pipeline. Analytically-driven Demand Gen teams rejoice!
Now that you’ve gotten a glimpse of what’s possible by reporting on Conversational Marketing with Campaign Attribution, let’s get into some specific reports.
Salesforce Campaign Attribution allows your team to answer the following about your Conversational Marketing Campaigns:
How many Leads were created as a result of an Experience?
Has a Lead or Contact engaged with my company via an Experience?
Which Experiences have been the most effective at getting my existing customers or target prospects to engage?
Before we dive into how they were built, keep in mind that all Qualified customers are able to get these reports out of the box. Click a link, make some tweaks, and you’ll be up and tracking ROI in no time. Hallelujah!
Now, let’s get into them.
#1. How many leads were created as a result of an Experience?
Report Type
Leads and Converted Lead Information
Title
Leads Created by Qualified, Last 90 Days
Description
90 day look-back on Leads that have Qualified.com as the Lead Source - 1st Touch. This includes Converted and Unconverted Leads.
Filters
Show me: All leads
Lead Source: Equals Website Conversation or starts with Qualified.com
This depends on what your organization has called this particular value.
Keep in mind, this field needs to be static. If it is overwritten at any point, then our data is now unreliable.
Created Date: LAST 90 DAYS
We use this for our Attribution reports because it gives a Goldilocks view of our Attribution trends. LAST 30 DAYS was too focused to see how we compared to prior efforts and LAST 6 MONTHS+ was too high level to be actionable.
Groups
Lead Status
Created Date
We suggest additionally grouping this by calendar week or month. This makes the report much more digestible and actionable.
Columns
The default fields included when you create the report are fine.
#2. How many leads/contacts have engaged with my company via a Conversational Marketing Experience?
Report Type
We’ll create two different versions of the same report, one for Leads and one for Contacts. If you’re an Advanced Reports user, you can use a Custom Report Type, too!).
Campaigns with Leads and Converted Lead Information
Campaigns with Contacts
Title
Leads / Contacts Attributed to Qualified.com
Filters
Show me: All Campaigns
Campaign Name: starts with Qualified.com
Member First Associated Date: LAST 90 DAYS
We use this for our Attribution reports because it gives a Goldilocks view of our Attribution trends. LAST 30 DAYS was too focused to see how we compared to prior efforts and LAST 6 MONTHS+ was too high level to be actionable.
Groups
Campaign Name
Member First Associated Date
We suggest additionally grouping this by calendar week or month. This makes the report much more digestible and actionable.
Lead Status
We won’t use this now, but will be helpful for future reports in Campaign Influence
Columns
The default fields included when you create the report are fine.
#3. Which Experiences have been the most effective at getting my existing customers or target prospects to engage?
Report Type
Campaigns with Contacts
Title
Target Accounts and Customers Attributed to Qualified.com
Filters
Show me: All Campaigns
Campaign name starts with Qualified.com
Member First Associated Date: LAST 90 DAYS
Target Account Field: Your Target Account Criteria
This field changes for every organization. Find the right
Account Type: Customer
Filter Logic
1 AND 2 (3 OR 4)
This will let you see Existing Customers OR Prospects Accounts that match your Target Account Criteria. Feel free to modify this to your business needs!
Groups
Campaign Name
Member First Associated Date
We suggest additionally grouping this by calendar week or month. This makes the report much more digestible and actionable.
Columns
The default fields included when you create the report are fine.
The finished product: your ROI dashboard
Takeaway - We like 90 day trends and simple number visualizations. This helps our team be actionable but with Executive-level clarity.
After you’ve built the campaign attribution reports, you’ll have plenty of flexibility on how you’d like to visualize the data. For our internal Dashboard and many of our customers, we’ve set it up to look like what you see below.
Create Campaign Attribution Reports and Dashboards to measure the impact of Conversational Marketing
Why did we choose these visualizations? When we create dashboards, we try to answer two questions:
Does the dashboard present the data in a way to give me an actionable next step?
Does it allow me to tell the story I need to tell to my team?
Is it easy to read?
For these visualizations, we’re interested in:
Trends over time (90 days) to see how changes in our marketing efforts may have impacted the Qualified output.
Breakdown by major categories that matter to us, either by Campaign or by some firmographic information like ICP.
Make it simple to see how we’re doing for the Fiscal Quarter and the 90 day window.
As you can see, our methodology isn’t anything crazy or groundbreaking. We believe in clear, digestible data to showcase the impact of the Marketing Team’s efforts. Most importantly, we believe in showcasing it where your entire team lives: inside of Salesforce.
If you have any questions or want to learn more about our Salesforce Campaign Attribution Reports and Dashboards, please feel free to reach out. You can reach me at [email protected] or simply come to the website to speak with us there. See you on the site!


.avif)


.svg)


